Hello, sorry this is slightly late. It is also slightly more chart-heavy than usual but have no fear: normal service will resume on Friday.
(While I have you, quite a few people have approached me in the last couple of weeks to say they enjoy this newsletter. This feedback is very much appreciated! Every week I ping one of these emails into the void so to hear something [positive] echo back is very satisfying.)
Anyhow, charts:
Chart 1: Impact of geopolitical distance on trade
In a new paper by the Bank of International Settlements, Deconstructing global trade: the role of geopolitical alignment, the authors attempt to quantify the trade-impact of “deglobalisation”.
To work out the so-called “geopolitical distance” between countries, the authors measure the degree to which countries vote similarly at the United Nations. They then measure the impact of distance on trade flows between 2017 and 2023.
They present three major findings:
Geopolitical distance has a material impact on trade volumes. They find that “quarter-on-quarter trade volume grew by around 2.5% less for geopolitically distant countries relative to geopolitically close ones over the 2017–23 period, after controlling for other factors.” Annualised this is about 10% less for geopolitically distant countries.
Geopolitical distance does not have such an obvious impact on prices received by exporters. They observe: “On the one hand, for tariffs imposed on trade between geopolitical adversaries, exporters may cut their prices to offset part of the tariff and protect their market share, with the size of the cut constrained by their profit margins. On the other hand, if some exporters choose to exit the market altogether, prices for the remaining exporters could rise, especially if adversaries’ and allies’ exports are poor substitutes for each other.” 1
The countries most reliant on geographicaly distant trade partners have fewer options for diversification, making it more difficult to manage risk.
Chart 2: A lack of variety
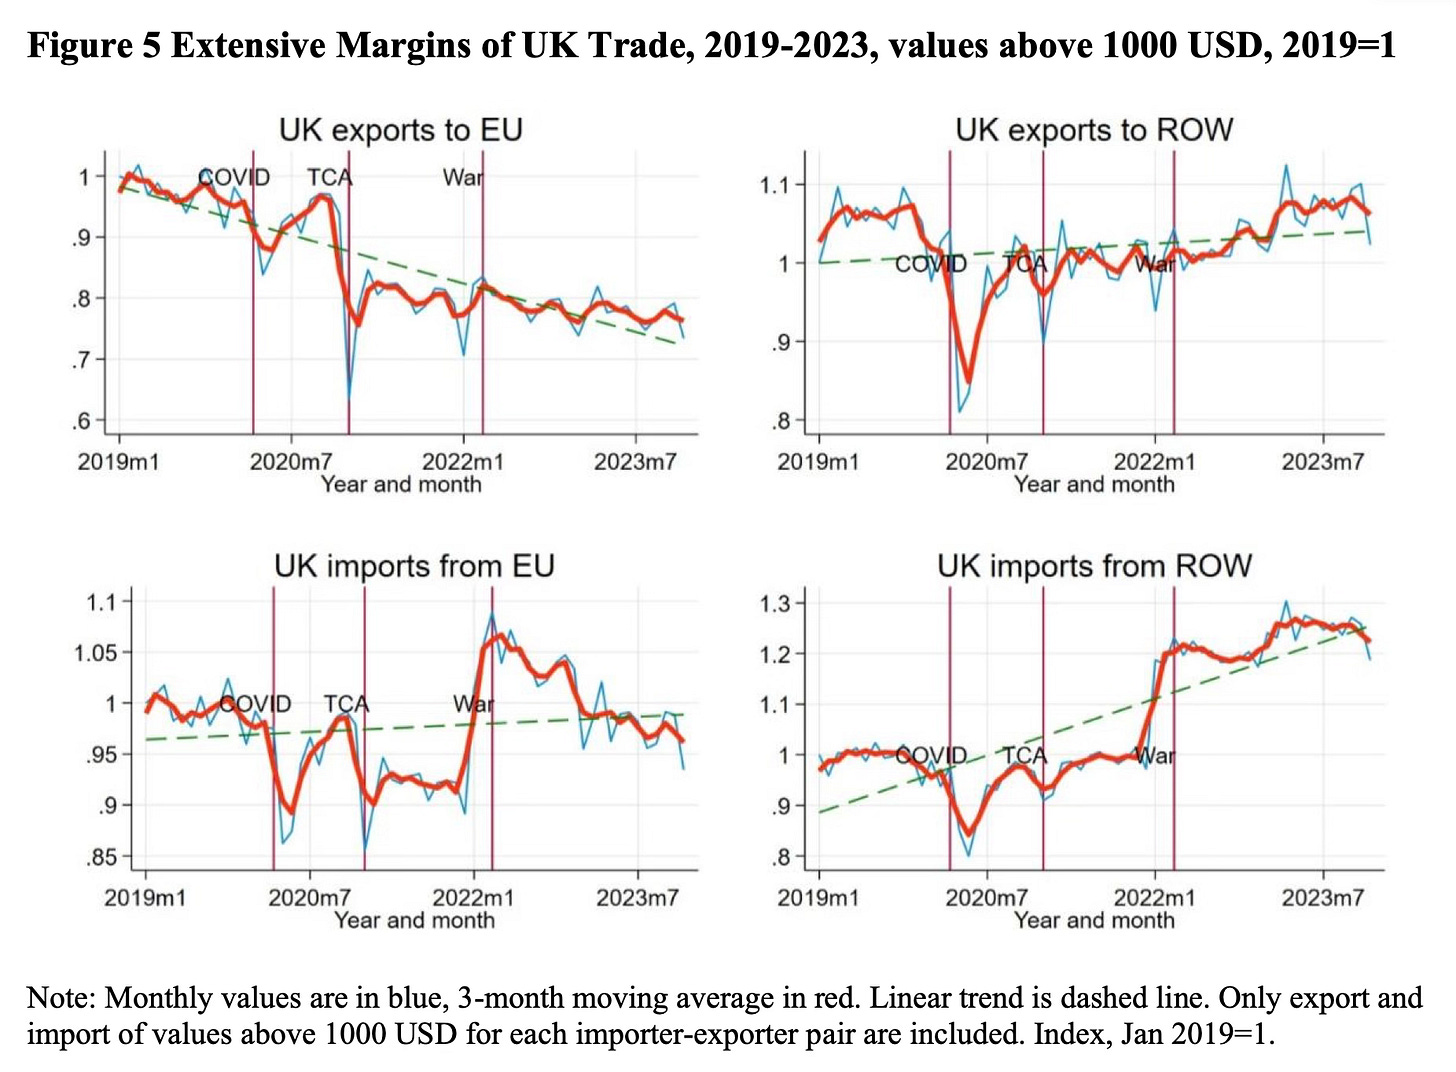
In a new research paper Jun Du, Xingyi Liu, Oleksandr Shepotylo and Yujie Shi attempt to quantify the impact of Brexit on EU-UK goods trade.
I know what you are thinking: “not another one”.
However, this paper adds something new beyond the now familiar putting-up-trade-barriers-with-your-most-important-trade-partner-has-negative-consequences fare.
In addition to quantifying the macro consequences, the authors look at the impact on the variety of goods traded. They find (as per the charts above):
There has been a stark decline in the variety of UK exports to the EU since January 2021.
The pattern for import varieties from the EU is notably different. Initially, UK import varieties from the EU experienced a decline, followed by a rapid recovery in 2021, suggesting stabilisation in the variety of goods imported. However, there was a prolonged decline in import variety from the EU during 2022-2023
UK trade with the rest of the world (ROW) exhibited growth in both export and import varieties, especially since the beginning of 2022.
All of this is to suggest that one of the major impacts of Brexit is that the UK exports a smaller variety of things to the EU than it used to. Which from a consumer perspective means that EU nationals have less access to the full range of products Britain has to offer. Sad.
Map 1: The fifth mode of supply
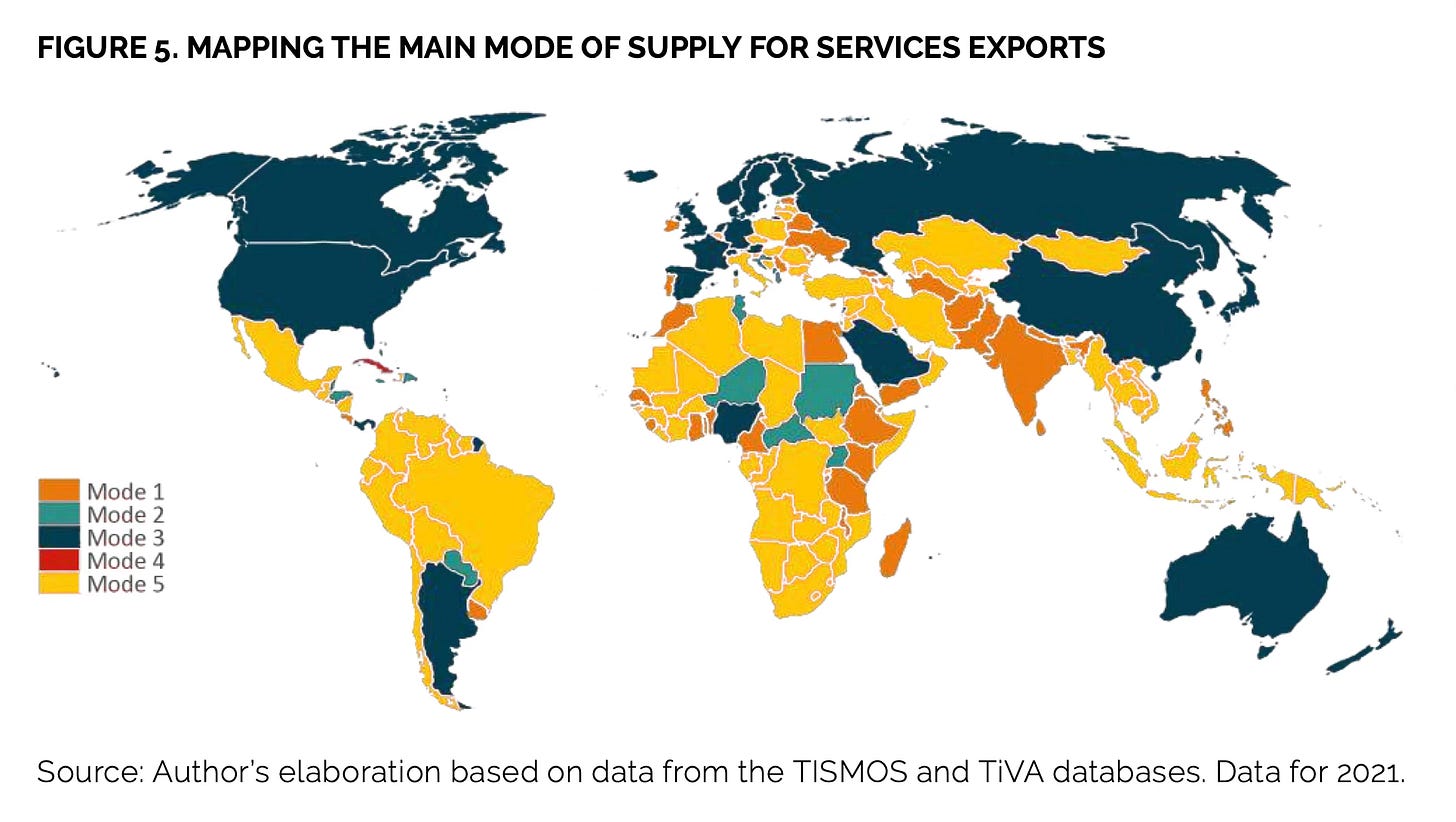
DG Trade’s Lucian Cernat has published a new ECIPE paper mapping the dominant mode of services export on a country-by-country basis, with a focus on Mode 5
To re-cap, services trade is normally broken down into four modes of supply:
You will notice that there is no Mode 5. This is because Mode 5 is not a real thing.
Rather, it is a concept created by Lucian to capture the value-add of services incorporated into trade goods. So, for example, the services value add of a modern car is considerable when you consider the sheer amount of software incorporated. This means that when you export a car (a good), you are also technically exporting a service. It also means that, indirectly, you can end up with tariffs levied on services, despite such a thing being otherwise frowned upon.
Anyhow, what the map above demonstrates is that while for rich countries the dominant mode of services trade is mode 3 – which in effect means their services firms are investing abroad in the form of subsidiaries and branches – for most of the developing world mode 5 is dominant. This really just means they export more goods than services, which isn’t really a surprise but does conceptually open up new possible development options.
As per the paper:
However, for many developing countries, it would be premature to put all eggs in the GATS services trade basket, even though as The Economist recently documented, there are examples of developing countries making great strides in certain services areas (e.g. tourism, audiovisual, computer and telecommunication services). Yet, for the overwhelming majority of developing countries, the present is still defined by trade in goods. That means that mode 5 services are a safe bet for a dual track development strategy relying on both current trade in goods and future services trade.
Table 1: Lots of Brexit stuff
David Henig, from The Internet, has written a paper looking at the future of the EU-UK relationship. It’s a decent overview of how we got to where we are and the challenges that come next. It also includes quite a few useful tables like the one above. Give it a skim!
Best wishes,
Sam
Some of you may remember me making similar observations recently in MFN, where I unsucessfully tried to pick a fight with the most popular person on the internet.


No surprise to see Mode 1 services as dominant in India and Philippines, but a useful sense check on the map
No surprise to see Mode 1 services as dominant in the likes of Indian and Philippines, but a useful sense check on the map